Abstract
Methods
With the cooperation of several food manufacturers, healthier versions of three popular food items (pizza, French fries, and chicken fingers) were developed. The manufacturers were asked to reduce the fat and energy density of these foods as much as possible while minimally affecting taste and appearance. The original food items and their modified versions were offered to students at four Denver Public Schools elementary schools during lunch. Student acceptance of the healthier food items was evaluated by assessing differences in meal participation and by rating appearance and palatability. Data from the original, unmodified foods were compared to the modified items using univariate and multivariate comparisons.
Results
Meal participation did not change after introducing the modified foods. Analyses of variance revealed a decrease in both appearance and palatability ratings for the modified pizza (p=0.01). Ratings for the modified French fries only decreased in taste (p=0.05), but not in appearance, whereas the ratings of both appearance and palatability for the modified chicken fingers did not differ from the original food item. Although some ratings for appearance and palatability decreased for the modified foods, these decreases were small and they were still rated by the students as acceptable.
Application to Child Nutrition Professionals
There is wide agreement among health and nutrition experts as to the need to provide healthier food options in schools. The results of this study suggest that one way to accomplish this task is to work directly with food manufacturers to improve the nutritional value and maintain the acceptable taste of some of the most popular food items served in schools. When small steps are taken to increase the nutritional value of these foods, the modified versions appear to be more widely accepted by the students. Making small changes to the most popular foods can lead to significant improvements in the overall nutritional composition of consumed items.
Full Article
Please note that this study was published before the implementation of Healthy, Hunger-Free Kids Act of 2010, which went into effect during the 2012-13 school year, and its provision for Smart Snacks Nutrition Standards for Competitive Food in Schools, implemented during the 2014-15 school year. As such, certain research may not be relevant today.
Childhood obesity is recognized as a serious public health issue. At least 15% of children in the United States between the ages of 6 and 19 are overweight, and the percentage is increasing (Krebs & Jacobsen, 2003; Ogden et al., 2002; Troiano et al., 1995). Overweight children suffer negative health and social consequences (Reilly et al., 2003) and are at high risk of becoming overweight or obese adults (Engeland et al., 2003).
Clearly, childhood obesity must be addressed in multiple settings – homes, schools, and communities – and through both behavioral changes and environmental modifications. Most children consume a large percentage of their total daily energy calories in schools (French et al., 2004), so efforts to address eating behavior and the school food environment are critical to successfully addressing incidence of childhood obesity (Kubik, Lytle, & Story, 2005). Strategies could include using nutrition education to help students make better food choices and improving the nutritional quality of items available to them. Much effort has focused on modifying foods offered in school vending machines, but these foods provide a very small proportion of daily energy intake (2.8%) in comparison to foods consumed during school lunch (11.2%) (Adair & Popkin, 2005; Nielsen et al., 2002). There has been some success in efforts designed to help students make better food choices. As part of a recent study by Conklin et al. (2005) school lunches were labeled with nutrition information. Results showed that high school students, when presented with nutrition information prior to the point of selection, chose lower-fat lunches and foods with fewer calories.
Health concerns surrounding food offered by schools have grown and, as a result, school nutrition programs have achieved a higher level importance on many schools’ agendas (Kubik et al., 2003; Wechsler et al., 2000). Efforts to modify the food environment in schools have involved the elimination of “unhealthy” food items and their substitution with healthier options (French et al., 1997; Luepker et al., 1996; Murphy-Zive et al., 2002; Osganian et al., 1996; Perry et al., 1989; Story et al., 2003). Promoting consumption of fruits and vegetables has been positive, especially efforts to increase fruit intake (French, 2005). Offering healthier snacks in vending machines, such as soy-based snacks and baked potato chips, appears to be a successful approach when attempting to lower high-fat snack choices. This is especially the case when prices are lowered (French et al., 1997; French et al., 2001; Jacobson & Brownell, 2000).
Training foodservice personnel to prepare lower-fat and -sodium foods also has had positive results (Osganian et al., 1996; Raizman et al., 1994), and all these referenced studies show a decrease in the percent of energy consumed from fat.
Although these interventions have been successful, they are time consuming and complex (Murphy-Zive et al., 2002; Osganian, et al., 1996). Part of the challenge in modifying the school food environment has been achieving a balance between a healthy diet and one that is accepted by students. One strategy that could be more vigorously evaluated is the idea of making small, gradual formulation changes to student favorites that are highest in fat and energy density. This strategy provides the food industry, which has been singled out as contributing to childhood obesity by providing unhealthy foods to schools, with an opportunity to be part of the solution to the growing health problem. Children and adolescents like fast food menu items and they prefer high-fat foods, such as pizza and fried potatoes (Cavadini, Siega-Riz, & Popkin, 2000; Krebs- Smith et al., 1996). It may be possible to make gradual changes to these popular items, in order to improve the quality of their contribution to student diets while maintaining student acceptance. The intent of this study is to evaluate this strategy by enlisting the help of school foodservice staff in one district as well as the food manufacturers that support this market.
Methodology
Research sample
The study involved First through Fifth Grade students from four elementary schools in the Denver Public Schools. Two of the participating schools had a majority of students who qualified for free and reduced-price lunches; the other two did not. Students were not identified individually, but an average 300 students per school participated in lunch daily. Every student who participated in lunch on the test days was included in the sample. Each student had an opportunity to complete three questionnaires, although day trips, illnesses, or other events could have interfered with lunch participation of some individuals. A total of 7,678 questionnaires were collected during the three-month control and intervention period.
Procedures
The managers of the four elementary schools were approached by the executive director of the Denver Public Schools’ Food and Nutrition Services with details about the study procedures and aims. All the managers permitted their schools to participate in the study. Three food manufacturers who provided popular food items for Denver Public Schools agreed to partake in the study. Modified versions of originally offered pizzas (The Schwan Food Company and Leprino Foods), French fries (McCain Foods), and chicken fingers (Zartic, Inc.) products were developed and distributed to the participating schools at no additional cost.
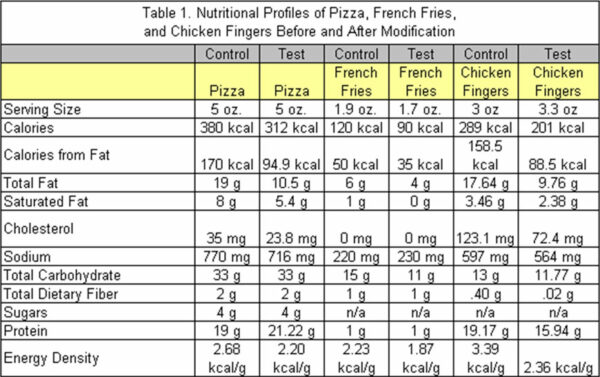
The manufacturers were asked to reduce fat and energy density as much as possible in the foods, while attempting to maintain the taste of the original items. There was a 45% reduction in fat in the test pizza, with a change of energy density from 2.68 kcal/g to 2.20 kcal/g. There was a 33% reduction in fat for the French fries, with a change in energy density from 2.23 kcal/g to 1.87 kcal/g. The test chicken fingers had 43% less fat than the original chicken fingers, and the energy density decreased from 3.39 kcal/g to 2.36 kcal/g (Table 1). Food manufacturers also were asked to develop products that looked as similar as possible to the original items served in the schools. Customer feedback questionnaires were developed using images of faces to indicate palatability and appearance of the product, ranging from an upset face for “bad” perceptions to a happy face to indicate a “good” Rating.The facial hedonic scale by Peryam and Kroll (Kroll, 1990) was used as a template. In addition, students were asked to indicate their grade level.
Ratings of palatability and appearance of the offered food products were assessed once for the control foods (originally served foods) and twice for the modified (reformulated) test foods. Each control food product was offered once a month in each school during lunch periods in the Fall 2004 semester. Sometimes leftovers from the previous day, including control items,were offered along with the test food product as an alternative choice. The schools’ foodservice staff distributed questionnaires for the control items, as well as the test food products, on the day of consumption without informing students that nutritional changes had been made to the product. If a student picked a tested product, s/he was given the questionnaire with instructions to eat a couple of bites before it filling out. During lunch periods, the foodservice staff walked around the cafeteria to collect completed questionnaires. Information about meal participation was obtained from the control and test versions of each food by using the number of meals sold on the corresponding dates.
A total of 7,678 questionnaires were collected and analyzed. Forty-one percent of the questionnaires were collected in the two schools with a high percentage of students eligible for free and reduced-price lunch meals (above 90%). Forty-nine percent of the collected questionnaires were from the two schools with a low percentage of students eligible free and reduced-price lunch meals (below 50%). For all schools, 20.8% of the participating students were in First Grade, 21.8% were in Second Grade, 19.7% were in Third Grade, 15.2% were in Forth Grade, and 16.4% were in Fifth Grade; 499 students failed to indicate their grade level.
Data Analysis
F-test and t-test comparisons were used to analyze differences in palatability ratings, appearance ratings, and meal participation of the control and test foods. All analyses were conducted using SPSS, version 12.0.
Results And Discussion
Meal participation measured as number of meals served did not change across the three phases (Control, Test 1, Test 2) for all foods (F=0.104, p=0.902). As a control measure, the number of collected questionnaires across the three time periods was compared. No significant change over time was observed (F=0.085, p=0.918).
Pizza
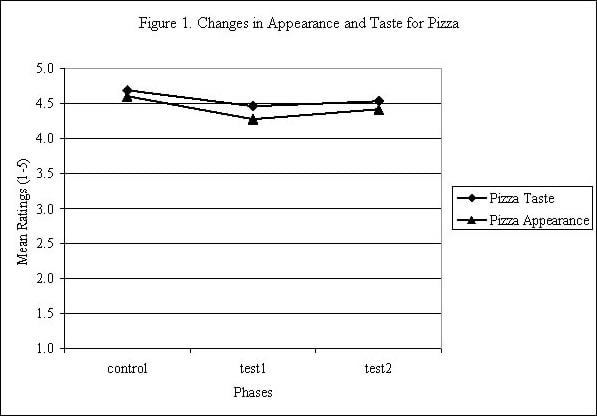
Differences in appearance (F=13.334, p=0.0) and taste (F=8.263, p=0.0) of the two versions of the pizza were found. However, as seen in Figure 1, these differences were minimal on the rating scales and students rated the healthier (test) version of the pizza extremely high. Some differences between pizza versions may have been due to the fact that the modified (test) pizzas were prepared differently from the original (control) pizza. The control pizza was oven-baked in a wrapper, while the test pizza was not separately baked and was served in a less-attractive box than the control item. Despite this difference in preparation, ratings of appearance were minimally different and increased from the first to the second exposure of the modified pizza (Control phase=4.6; Test 1 phase=4.3; and Test 2 phase=4.4). This could indicate that students gained familiarity with the changed appearance of the pizza.
Considering the possibility that First-graders might not have understood the questions asked, separate analyses were conducted excluding those students. While the results did not change when this age group was excluded, interesting results were revealed when appearance and taste for pizza was analyzed separately by school grade. Taste, but not appearance, decreased for First-graders (F=5.566, p=0.019), while no differences in either taste or appearance for control and test pizza products were observed for Second- and Fifth-graders. Third- and Fourth-graders, however, rated both taste (F=4.699, p=0.031 and F=13.213, p=0.0, respectively) and appearance of the test pizzas (F=10.769, p=0.001 and F=12.077, p=0.001, respectively) lower than the control pizza. No significant differences in food appearance and palatability changes were found when comparing the schools according to the percentage of eligibility for free and reduced-price meals. Students at all the schools appeared to have similar preferences in appearance and taste of the pizzas offered.
French fries
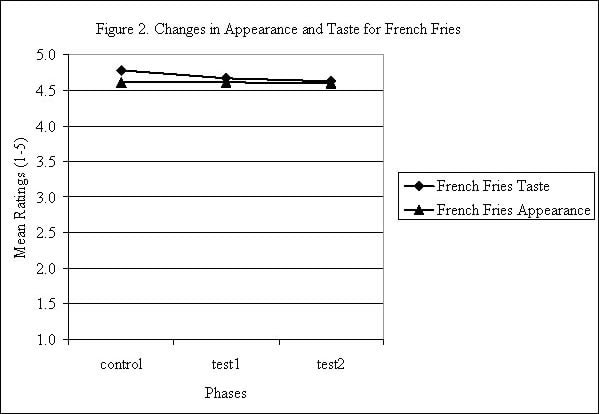
The modified (test) French fries were rated significantly lower in taste (F=3.576, p=0.028), but not in appearance (F=0.82, p=0.921) than the control fries. Students did not appear to have detected any difference in appearance between the two versions of French fries, and the decrease in taste rating was although statistically significant, minimal in terms of mean taste ratings (from 4.77 to 4.64). (Figure 2). Taste ratings for the modified French fries were still extremely high overall. Similar results were found when First-graders were excluded from the data analysis; without the First-graders, a significant decrease in taste (F=3.321, p=0.036), but not in appearance (F=0.444, p=0.641) was identified.
Analyses separated by school grade revealed that neither First- nor Fourth-graders identified a difference in taste or appearance between the control or test French fries. The Second-graders, however, showed higher ratings in taste for the control French fries (F=7.574, p=0.006), but no difference in ratings of appearance (F=1.136, p=0.287). On the other hand, Fifth-graders showed an increase in appearance for the test French fries (F=5.864, p=0.016) and no difference in ratings for taste (F=0.888, p=0.346). Again, there were no differences in appearance or taste ratings between the schools with a low and high percentage of students eligible for free and reduced-price meals.
Chicken Fingers
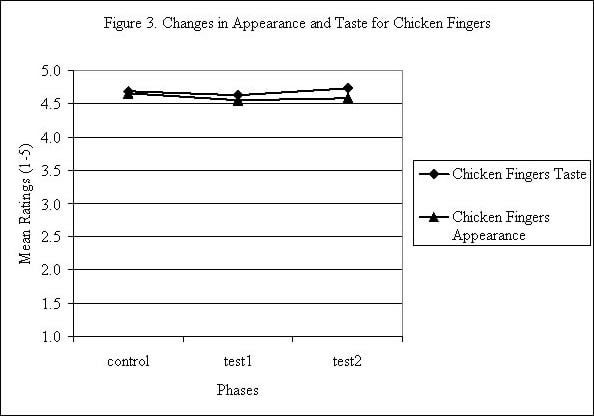
Comparison of the two versions of chicken fingers revealed a decrease in appearance ratings for the modified item (F=14.867, p=0.0), but no changes in taste (Figure 3) ratings. When the First- graders ere excluded from the results, appearance ratings decreased still (F=6.159, p=0.002).
Taste ratings decreased from control values for the first exposure of the modified chicken fingers (F=8.172, p=0.004), but increased compared to control ratings on the second exposure (F=5.315, p=0.021). First-, Second-, and Fourth-graders did not rate the control and test chicken fingers as different in appearance and taste. For the Third-graders, the ratings for appearance decreased from control to test chicken fingers (F=4.831, p=0.028), while the taste ratings did not differ.
Ratings from the Fifth-graders showed a decrease in both appearance (F=15.545, p=0.0) and taste (F=5.153, p=0.024). Comparing the two types of schools based on free/reduced-price eligibility did not reveal any differences in appearance and taste ratings.
Conclusions And Applications
The results were extremely encouraging in finding that modified versions of popular lunch items were highly accepted by the Denver Public Schools students. While there were some differences in appearance and taste between the two versions of the food products, the magnitude of these differences was small enough to be of no meaningful consequence. The results are due mainly to the very large number of questionnaires collected which leads to statistically significant results of only small mean differences. All versions of the modified foods were rated extremely high for appearance and taste in both control and test lunches (Figures 1-3), and meal participation did not change when the modified food versions were introduced.
Making small changes to improve the nutritional quality of popular school lunch items could be a very useful strategy in addressing childhood obesity. The food manufacturers participating in this study were very successful in making significant improvements to the nutritional profile of the foods while minimally affecting taste. Encouraging food manufacturers to engage in the modification of high-fat, energy-dense foods may represent a successful strategy to improving the nutritional environments of schools. This strategy could allow food manufacturers to contribute positively to a school’s foodservice department, helping it address the growing obesity epidemic while continuing to succeed financially. This is a way of improving diet quality while still offering foods that are popular with students. Certainly, it will be important to obtain data about the continued acceptability of such modified food items over time. The fact that ratings increased from the first to the second exposure of the modified items suggests that they would continue to be accepted, but long-term studies are needed. Further, based on the initial success of this strategy, food manufacturers may be motivated to devote more time to ensuring that the appearance of healthier versions of their foods are more similar to the original items.
It will be critical to see whether these effects could be maintained over a longer period of time. The question might be whether students will keep ordering the fat- and calorie-reduced foods without complaint or a desire to change the foods back to the original formulations. It also would be interesting to find out whether such small changes could be introduced successfully in foods available in a la carte service in middle and high schools. It appears that many a la carte items offered to students are disproportionably high in fat and sugar (Kubik et al., 2003) and, therefore, the reduction in the fat and sugar contents of these foods could be beneficial to improving the quality of the adolescent diet. However, it is possible that older students will be more sensitive to changes in their favorite foods; starting with younger students may be more feasible for success over the long term. The results indicate that student acceptance of the foods’ appearance and taste vary across school grades and, therefore, by age.
Total or macronutrient intake or food waste was not measured in this study. We can predict that substitution of the modified foods would result in a lower fat intake and a lower energy-density diet. Other research suggests that total energy intake is less when dietary fat (Bray et al., 2004; Gehling et al., 2005) and energy density (Bell et al., 1998; Bell & Rolls, 2001; Kral et al., 2004; Rolls et al., 2005) are lower. In summary, this study provides evidence that a strategy of collaboration between school foodservice staff and food manufacturers to reduce the fat content and energy density of various food items is possible, and that maintaining product taste and appearance can be helpful in addressing childhood obesity. In this study, three of the most popular foods in schools were modified. It may be possible to apply this strategy to other foods, as well, and, over time, continue to make small changes to these popular items in an effort to further improve their nutritional profile.
Acknowledgments
The authors wish to thank the Denver Public School foodservice staff from the four participating schools, as well as the food manufacturers who kindly provided the food products that were reformulated and tested.
References
Adair, L.S., & Popkin, B.M. (2005). Are child eating patterns being transformed globally? Obesity Research, 13, 1281-1299.
Bell , E.A., Castellanos, V.H., Pelkman, C.L., Thorwart, M.L., & Rolls B.J. (1998). Energy density of foods affects energy intake in normal-weight women. AmericanJournal of Clinical Nutrition, 67, 412-420.
Bell , E.A., & Rolls, B.J. (2001). Energy density of foods affects energy intake across multiple levels of fat content in lean and obese women. American Journal Clinical Nutrition, 73, 1010- 1018.
Bray, G.A., Paeratakul, S., & Popkin, B.M. (2004). Dietary fat and obesity: A review of animal, clinical and epidemiological studies. Physiology and Behavior, 83, 549-555.
Cavadini, C., Siega-Riz, A.M., & Popkin, B.M. (2000). U.S. adolescent food intake trends from 1965-1996. Western Journal of Medicine, 173, 378-383.
Conklin, M.T., Cranage, D.A., & Lambert, C.U. (2005). Nutrition information at point of selection affects food chosen by high school students. Journal of Child Nutrition & Management, 29. [Available
online: http://docs.schoolnutrition.org/newsroom/jcnm/05spring/conklin/index.asp.]
Engeland, A., Bjorge, T., Tverdal, A., & Sogaard, A.J. (2004). Obesity in adolescence and adulthood and the risk of adult mortality. Epidemiology, 15, 79-85.
French, S.A. (2005). Public health strategies for dietary change: Schools and workplaces. Journal of Nutrition, 135, 910-912.
French, S.A., Jeffery, R.W., Story, M., Hannan, P., & Snyder, P. (1997). A pricing strategy to promote low-fat snack choices through vending machines. American Journal of Public Health, 87, 849-851.
French, S.A., Jeffrey, R.W., Story, M., Breitlow, K.K., Baxter, J.S, Hannan, P., & Snyder, M.P. (2001). Pricing and promotion on low-fat vending snack purchases: The CHIPS study.American Journal of Public Health, 91, 112-117.
French, S.A., Story, M., Fulkerson, J., & Hannan, P. (2004). An environmental intervention to promote lower-fat food choices in secondary schools: Outcomes of the TACOS study.American Journal of Public Health, 94, 1507-1512.
Gehling, R.K., Magarey, A.M., & Daniels, L.A. (2005). Food-based recommendations to reduce fat intake: An evidence-based approach to the development of a family-focused child weight management programme. Journal of Pediatrics and Child Health, 41, 112-118.
Jacobson, M.F., & Brownell, K.D. (2000). Small taxes on soft drinks and snack foods to promote health. American Journal of Public Health, 90, 854-857.
Kral T.V.E., Roe L.S., & Rolls B.J. (2004). Combined effects of energy density and portion size on energy intake in women. American Journal of Clinical Nutrition, 79, 962–968.
Krebs, N.F., & Jacobson, M.S. (2003). Prevention of pediatric overweight and obesity: Policy statement. Pediatrics, 112, 424-430.
Krebs-Smith, S.M., Cook, A., Subar, A.F., Cleveland, L., Friday, J., & Kahle, L.L. (1996). Fruit and vegetable intakes in children and adolescents in the United States. Archives of Pediatrics and Adolescent Medicine, 150, 81-86.
Kroll, B.J. (1990). Evaluating rating scales for sensory testing with children. Food Technology, 44, 78-86.
Kubik, M.Y., Lytle, L.A., Hannan, P.J., Perry, C.L., & Story, M. (2003). The association of the school food environment with dietary behaviors of young adolescents. American Journal of Public Health, 93, 1168-1173.
Kubik, M.Y., Lytle, L.A., & Story, M. (2005). Soft drinks, candy, and fast food: What parents and teachers think about the middle school food environment. Journal of the American Dietetic Association, 105, 233-239.
Luepker, R.N., Perry, C.L., McKinlay, S.M., Nader, P.R., Parcel, G.S., Stone, E.J., Webber, L.S., Elder, J.P., Feldman, H.A., Johnson, C.C., Kelder, S.H., & Wu, M.(1996). Outcomes of a field trial to improve children’s dietary patterns and physical activity: The Child and Adolescent Trial for Cardiovascular Health (CATCH). Journal of the American Medical Association, 275, 768- 776.
Murphy-Zive, M.M., Pelletier, R.L., Sallis, J.F., & Elder, J.P. (2002). An environmental intervention to improve a la carte foods at middle schools. Journal of the American Dietetic Association, 102, Suppl. 3, S76-S78.
Nielsen, S.J., Siega-Riz, A.M., & Popkin, B.M. (2002). Trends in food locations and sources among adolescents and young adults. Preventive Medicine, 35, 107-113.
Ogden , C.L., Flegal, K.M., Carroll, M.D., & Johnson, C.L. (2002). Prevalence and trends in overweight among U.S. children and adolescents, 1999-2000. Journal of the American Medical Association, 288, 1728-1732.
Osganian, S.K., Ebzery, M.K., Montgomery, D.H., Nicklas, T.A., Evans, M.A., Mitchell, P.D., Lytle, L.A., Snyder, M.P., Stone, E.J., Zive, M.M., Backman, K.J., Rice, R., & Parcel, G.S. (1996). Changes in the nutrient content of school lunches: Results from the CATCH Eat Smart Food Service Intervention. Preventive Medicine, 25, 400-412.
Raizman, D.J., Montgomery, D.H., Osganian, S.K., Ebzery, M.K., Evans, M.A., Nicklas, T.A., Zive, M.M., Hann, B.J., Snyder, M.P., Clesi, A.L. (1994). CATCH: Food service program process evaluation in a multicenter trial. Health Education Quarterly, 21, Suppl. 2, S51-S71.
Reilly, J.J., Methven, E., McDowell, Z.C., Hacking, B., Alexander, D., Stewart, L., & Kelnar,
C.J. (2003). Health consequences of obesity. Archives of Diseases of Childhood, 88, 748-752.
Rolls, B.J., Drewnowski, A., & Lediwke, J.H. (2005). Changing the energy density of the diet as a strategy for weight management. Journal of the American Dietetic Association, 105, Suppl.1, S98-S103.
Story, M., Snyder, M.P., Anliker, J., Weber, J.L., Cunningham-Sabo, L., Stone, E.J., Chamberlain, A., Ethelbah, B., Suchindran, C., & Ring, K. (2003). Changes in the nutrient content of school lunches: results from the Pathways study. Preventive Medicine, 37, S35-S45.
Troiano, R.P., Flegal, K.M., Kuczmarski, R.J., Campbell S.M., & Johnson, C.L. (1995). Overweight prevalence and trends for children and adolescents: The National Health and Nutrition Examination Surveys, 1963-1991. Archives of Pediatrics and Adolescent Medicine, 149, 1085–1091.
Wechsler, H., Brener, N.D., Kuester, S., & Miller, C. (2001). Food service and foods and beverages available at school: Results from the School Health Policies and Programs Study 2000. Journal of School Health, 71, 313-322.
Biography
Stroebele and Hill are, respectively, a postdoctoral research fellow and professor of pediatrics for the Center for Human Nutrition at the University of Colorado at Denver Health Sciences Center in Denver, CO. Barz is senior vice president of Leprino Foods in Denver, CO. Wittrock and Lesh are, respectively, the retired and current executive director of the Food and Nutrition Services for Denver Public Schools. Wittrock is a School Nutrition Association past president.
Purpose / Objectives
The objective of this study is to evaluate student acceptance of popular school lunch items that are reduced in fat and energy density.